
For over ten years, SORGEM Evaluation has been analysing public offers relating to the French market using data published on the AMF’s website. We have chosen to play an active role in disseminating the economic and financial analyses carried out in connection with public offers, and we regularly publish selected analyses drawn from our review of independent expert reports.
This note sets out, amongst other things, trends in the number and type of public takeover bids, the valuation methods and parameters used by independent experts and lead underwriters, and highlights some recent articles on the subject.
As a reminder, in the case of public offers likely to give rise to conflicts of interest within the board of directors, the supervisory board or the competent body of the target company, as well as in the case of mandatory delistings, an independent expert is appointed by the management bodies of the company whose securities are the subject of the offer. Their role is to issue an opinion on the fairness of the financial terms offered by the offeror to the shareholders of the target company. The expert issues a detailed report in which they analyse the value of the company, the valuation work carried out by the presenting institution and any related agreements (transactions prior to or following the offer, management packages, service contracts, liquidity guarantees, financing of the offer, etc.).
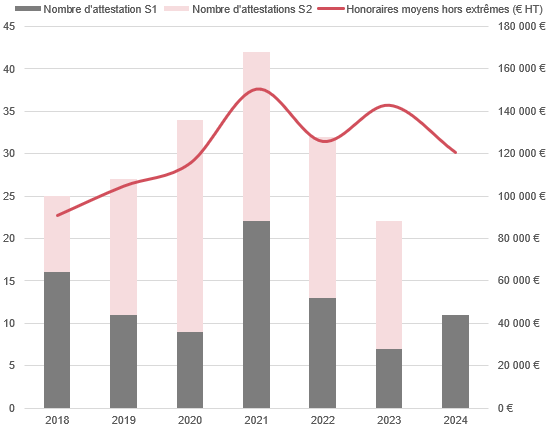
Number of equity certificates recorded by the AMF in connection with public offers and the average fees charged by independent experts
The number of fairness opinions produced in connection with public offers fell in 2023 (22 opinions recorded, compared with an average of 35 per year over the last ten years).
The trend for 2024 shows an increase compared with the first half of 2023, which marked a low point in 2023. We note an increase over time in the number of bids submitted during the first half of the year, which continued into July and may suggest that the recovery is sustainable.
In 2023/2024, half of the bids were initiated by family or financial investors (as opposed to industrial investors). This proportion is down on 2022, when financial investors initiated 70 per cent of the bids.
The offers mainly concern small and medium-sized enterprises (known as ‘small’ and ‘mid-cap’ companies). In the first half of 2024, the median equity capital of companies, estimated at the offer price, stood at €83 million, ranging from €13 million to €1.4 billion.
After an upward trend between 2018 and 2021, the expert’s fee (excluding extreme outliers) has since fluctuated around €130,000.
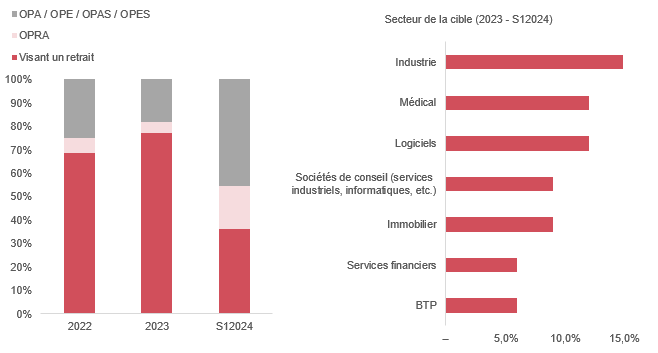
Types of Public Offerings Encountered and the Target’s Sector
In terms of sector, the companies that have attracted the most public offers over the last two years are industrial firms, as well as those operating in the medical and software sectors.
Furthermore, in relative terms, there was an increase in public share buyback offers during the first half of 2024 and a decrease in the initiator’s intention to implement a compulsory delisting.
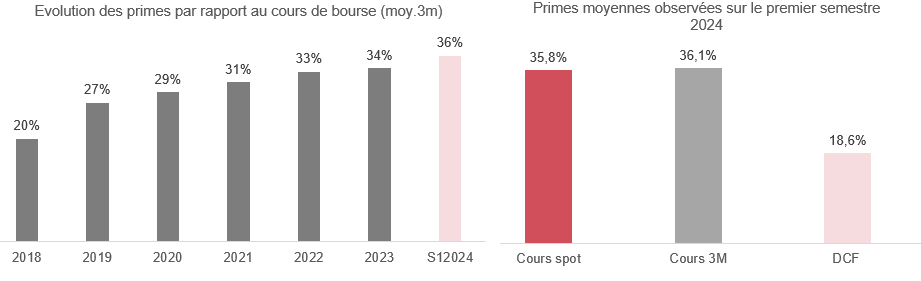
Premiums offered to shareholders
Premiums relative to the average share price over the three months preceding the offer have been rising in recent years.
In the first half of 2024, the average premium observed relative to the share price (3-month average) stood at 36 per cent, compared with an average premium of 19 per cent relative to the DCF valuation.
It should be noted that the premiums offered mask significant disparities between the various offers.
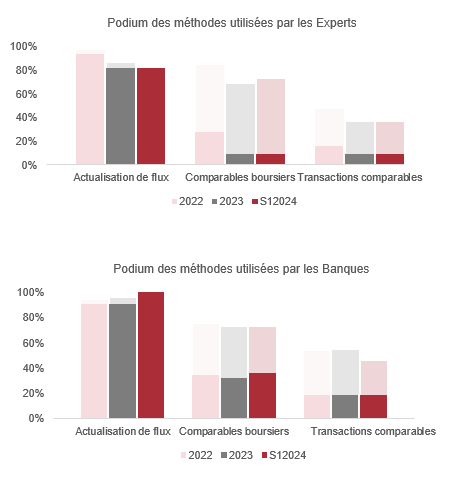
Methods favoured by independent experts and arranging banks
The method favoured by experts and banks remains discounted cash flow analysis, which is the primary method chosen in more than 8 out of 10 cases.
Whilst the use of the market comparables method was historically significant, we have observed a decline in its use over recent years. Experts rely on this method less than bankers, but use it more for information purposes only, i.e. without using it to establish a valuation range (shown in pale colours in the accompanying graphs).
The method based on observed transactions involving private companies remains less widely used than in the past, particularly amongst experts. This may stem from a lack of relevant benchmarks (a decline in the number of transactions carried out in an economic and financial context comparable to that prevailing at the time of the transaction). The method continues to be used to a significant extent for guidance purposes.
A closer look at the multiples considered by independent experts and underwriting banks
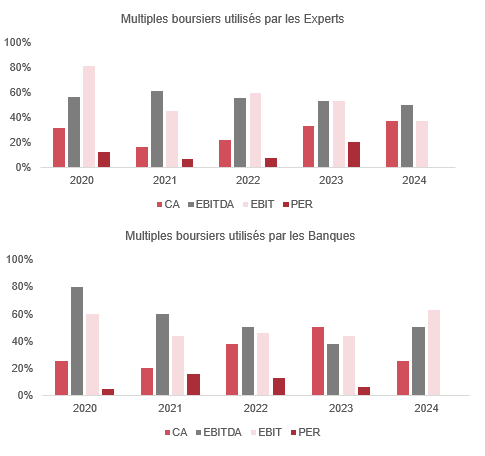
When the market comparables method is applied, experts and investment banks tend to favour EBITDA and EBIT aggregates.
The market multiples used by experts and banks have varied over recent years.
There has been a sharp decline, more pronounced among banks, in the use of the EBITDA multiple since 2019. This decline can be attributed to the introduction of IFRS 16.
It is noted that neither experts nor banks used the P/E ratio during the first half of 2024. This may be explained by the absence of financial services companies amongst the targets, a sector in which this multiple is usually applied.
Benchmarks used by independent experts and the underwriting banks
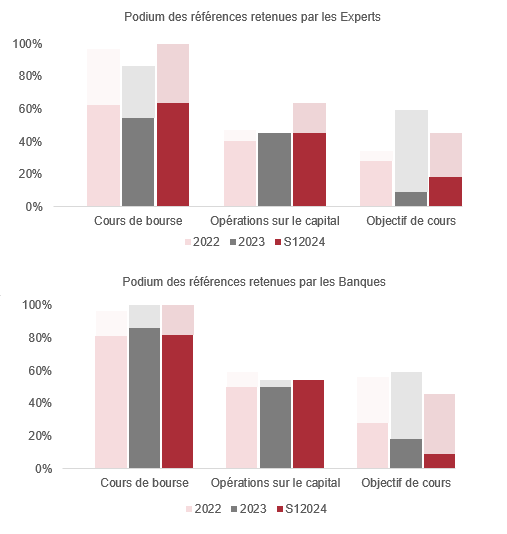
When it comes to public offers for listed companies, it is not surprising to find the share price cited as the primary benchmark by the experts and the banks.
Share capital transactions are regularly used when such transactions have taken place close to the date of the offer announcement.
Price targets are, by definition, only available where the target company is covered by analysts. As such, the use of this benchmark varies and depends on the extent to which the company is covered. It is worth noting that this benchmark has been used more as a guide by both experts and banks over the last two years.
Components of the discount rate and long-term growth
Over the last five years, the discount rates applied by valuers and banks have averaged around 10 per cent. Whilst these rates have remained relatively constant amongst valuers, a slight increase has been observed amongst banks, in line with the rise in sovereign bond yields.
A closer look at the parameters selected by the experts
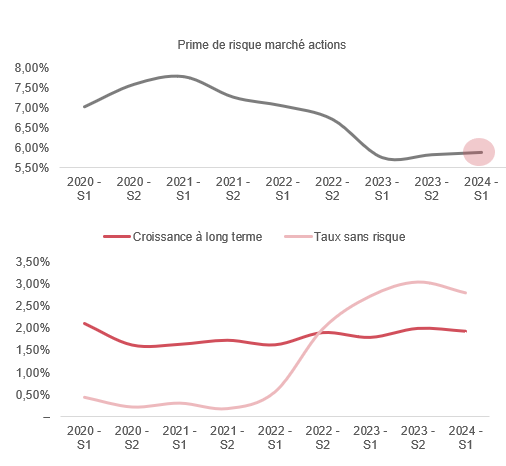
The discount rate used by the experts is almost exclusively estimated using the CAPM formula.
The equity market risk premium used in this context has historically fallen within a range of between 7.1% and 5.9%. In the first half of 2023, the average reached a 10-year low of 5.75%.
However, this fall does not necessarily imply a general reduction in cash flow discount rates, as we note a sharp rise in the risk-free rate over the same period.
The risk-free rate does, in fact, follow the trend of sovereign bond yields. Following a sharp rise over the last two years, a slight decrease was observed in the first half of 2024.
A selection of articles on the subject
- Les Echos Investir, ‘Boiron: takeover bid fails’. Link to article
- Le Revenu, “Despite an unfavourable climate, takeover bids remain numerous and generous”. Article link
- Do share buybacks drive up share prices? Article from Le Vernimmen. Link to article
Disclaimer & contacts
This study has been compiled for information purposes only, using SORGEM Evaluation’s databases, which are based on publicly available information on the AMF website.
The authors and SORGEM Evaluation accept no liability whatsoever for the transcription, analysis or interpretation of the information contained in this note.
Contacts for this study:
- Thomas HACHETTE, Partner, SORGEM Evaluation;
- Etienne LANGER, Manager, SORGEM Evaluation;
- Mathilde FERRERO, Consultant, SORGEM Evaluation.

