
For over ten years, SORGEM Evaluation has been analysing public offers relating to the French market using data published on the AMF’s website. We have chosen to play an active role in disseminating the economic and financial analyses carried out in connection with public offers, and will regularly publish selected analyses drawn from our review of independent expert reports.
This note analyses, amongst other things, trends in the number and type of public takeover bids, the valuation methods and parameters used by independent experts, and highlights some recent articles on the subject.
As a reminder, in the case of public offers likely to give rise to conflicts of interest within the board of directors, the supervisory board or the competent body of the target company, as well as in the case of mandatory delistings, an independent expert is appointed by the management bodies of the company whose securities are the subject of the offer. Their role is to issue an opinion on the fairness of the financial terms offered by the offeror to the shareholders of the target company. The expert issues a detailed report in which they analyse the value of the company, the valuation work carried out by the presenting institution and any related agreements (transactions prior to or following the offer, management packages, service contracts, liquidity guarantees, financing of the offer, etc.).
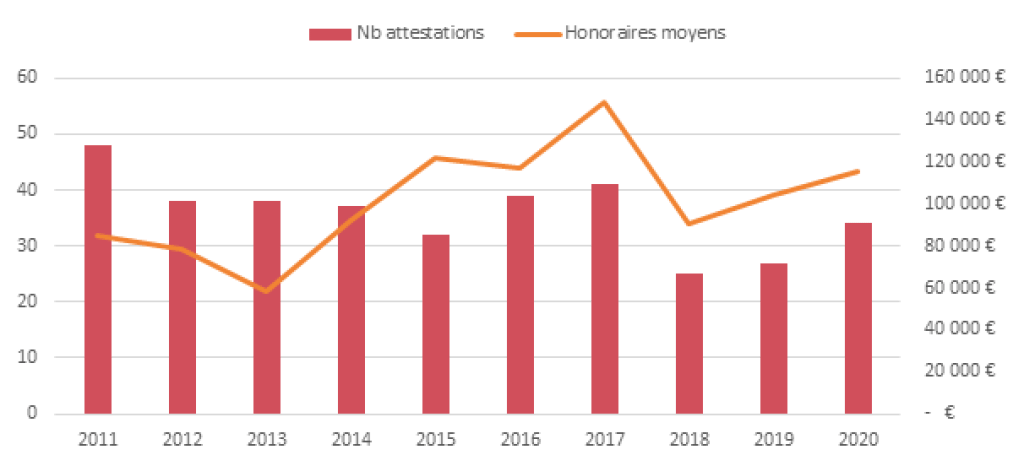
Number of fairness opinions recorded by the AMF and average fees charged by independent experts
The number of fairness opinions produced in connection with public offers fell significantly in 2018 but has been rising over the last three years.
This trend appears to be continuing in 2021, with 23 certificates recorded in the first half of the year alone (compared with an average of 12 between 2018 and 2020).
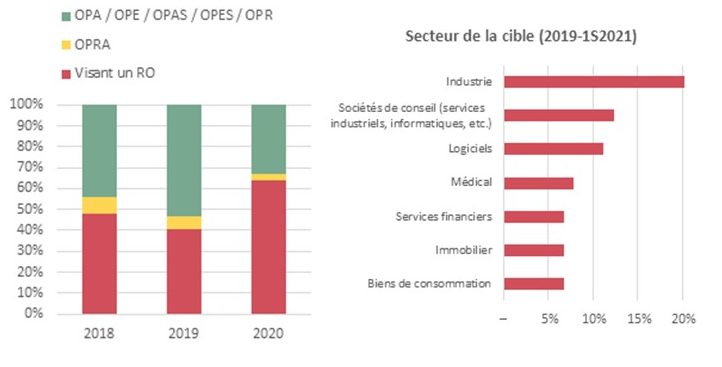
Increase in public offers followed by a compulsory delisting
We note that public offers followed by a mandatory delisting increased in 2020, accounting for nearly two-thirds of all offers. This increase coincides with the implementation of the reduction in the shareholding threshold required to trigger delisting (the Pacte Act).
There has also been a low number of public share buyback offers: none so far in 2021.
In terms of sector, the companies that have attracted the most public offers in recent years are industrial firms, consultancy firms (industrial services, IT, etc.) and software development companies.
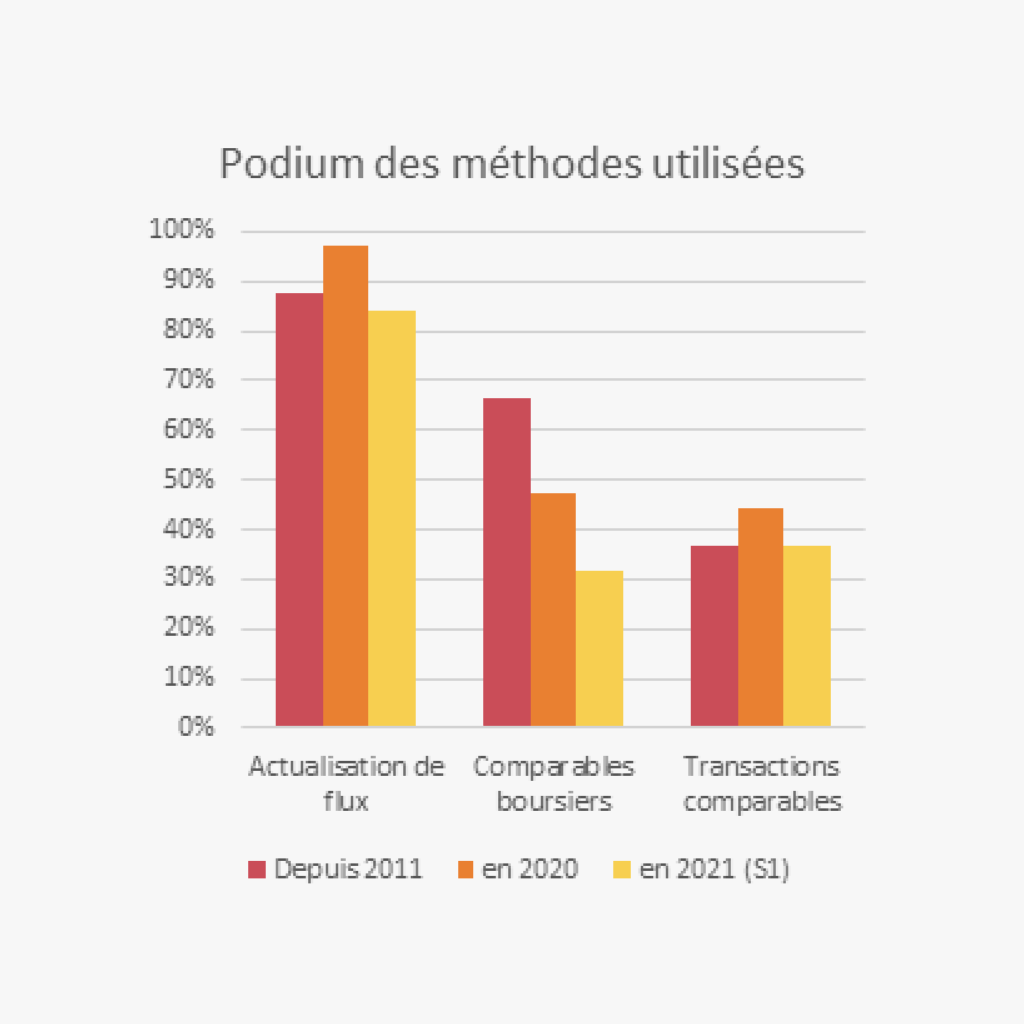
Methods favoured by experts
The method favoured by independent experts remains discounted cash flow analysis, which is the primary method chosen in more than 8 out of 10 cases.
Whilst the use of the market comparables method was historically significant, we have observed a decline over the last 18 months. The impact of the health crisis on companies’ latest financial results may have led to this method being abandoned.
By contrast, the comparable transactions method has not followed the same trend, with its use remaining relatively stable over time.
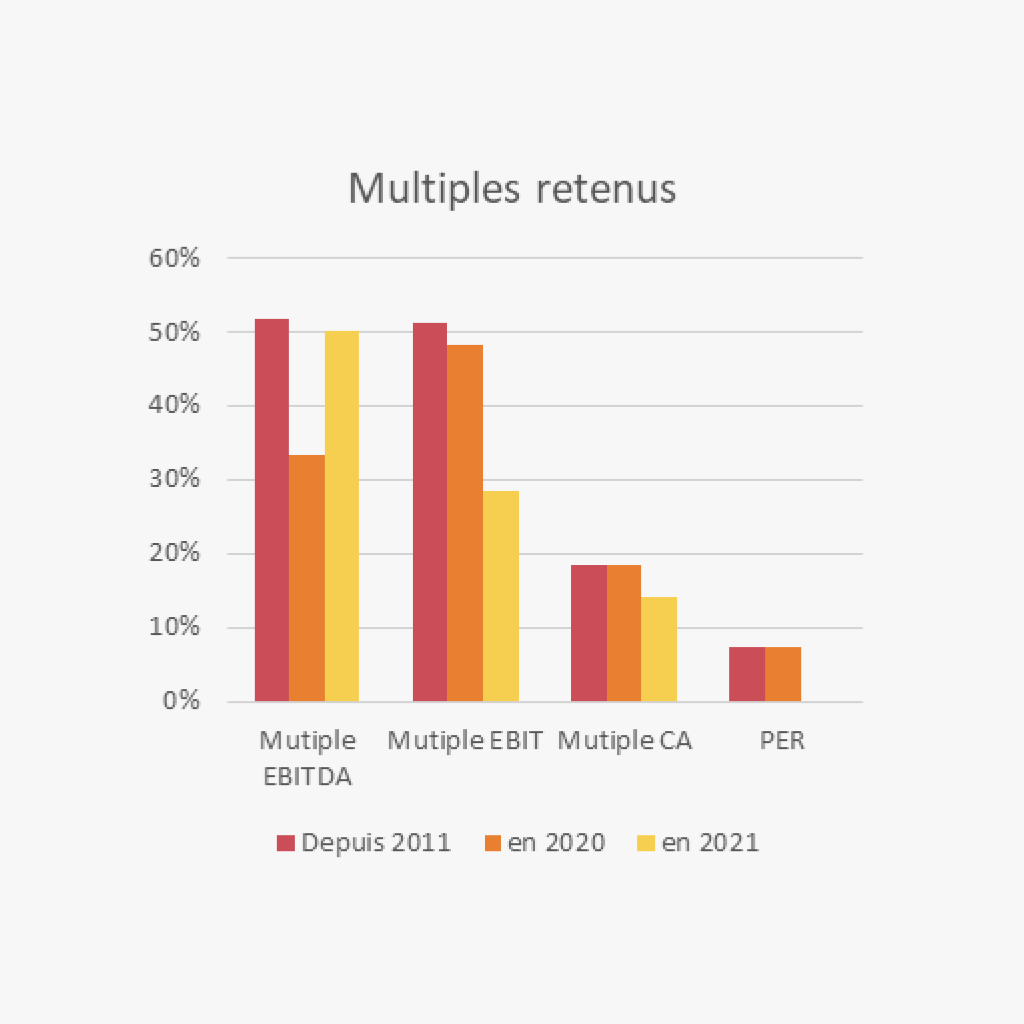
Focus on the multiples under consideration
The multiples primarily used relate to the EBITDA and EBIT aggregates. Whilst their respective usage has historically been equal (slightly above 50%), we note a shift away from the EBITDA multiple in 2020, in favour of the EBIT multiple. This decline coincided with the first-time adoption of IFRS 16 (2019 figures), which had a particular impact on EBITDA in certain sectors.
The trend reversed in the first half of 2021, with EBITDA multiples favoured over EBIT multiples.
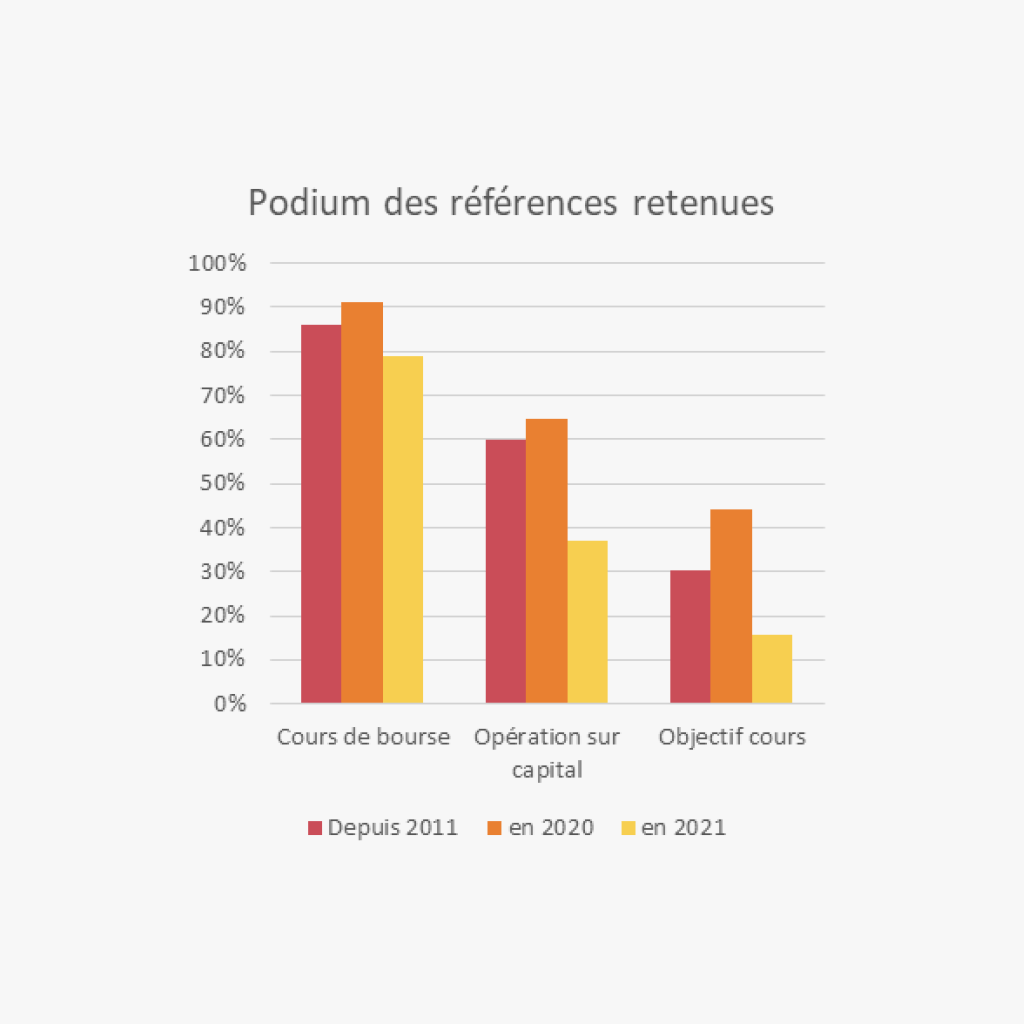
Benchmarks selected by the experts
When it comes to public offers for listed companies, it is not surprising to find the share price cited as the primary benchmark used by independent experts.
Share capital transactions are regularly used when such transactions have taken place close to the date of the offer announcement.
Price targets are, by definition, only available where the target company is covered by analysts. As such, the use of this benchmark varies and depends on the extent to which the company is covered.
Discount rate
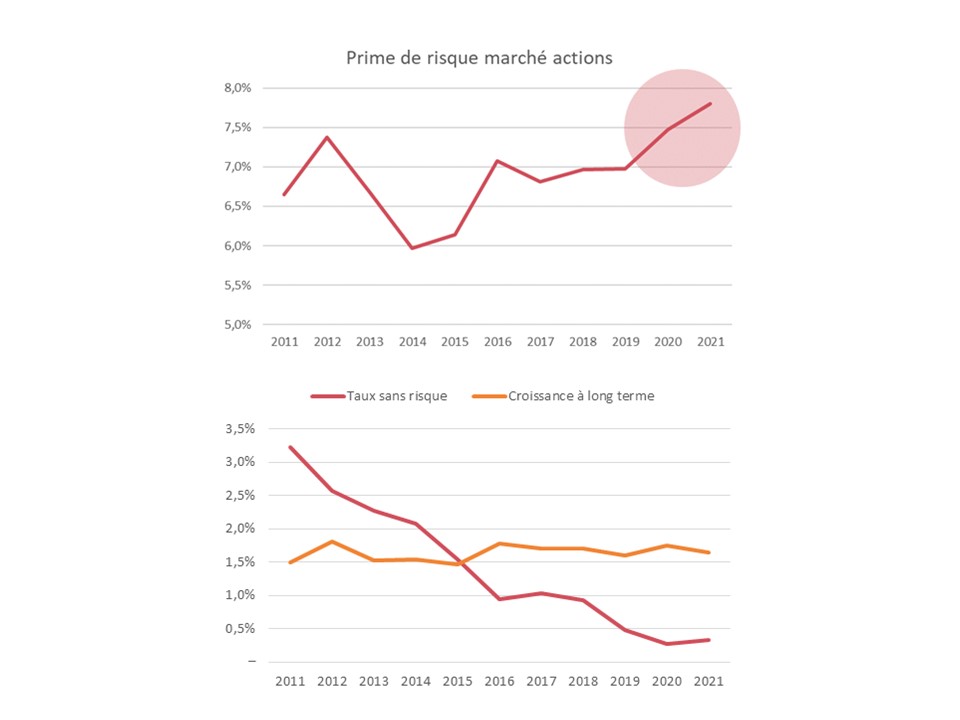
The discount rate used by the experts is calculated almost exclusively using the CAPM formula.
The equity market risk premium used in this context has historically fluctuated within a range of 6.0% to 7.5%, with a notable increase in 2020 and 2021. The increase in the market risk premium, calculated as an average for the first half of 2021, may seem surprising, given that these premiums are often estimated on the basis of share prices, which rose sharply over the period. Could this be a way of factoring in the risks of a market correction highlighted in the AMF’s latest risk map?
The average risk-free rate used declined steadily over the period analysed, in line with trends in sovereign bond yields.
The long-term growth rate, used in particular in the calculation of the terminal value, remained stable over time, averaging between 1.5% and 1.75%.
A selection of articles on the subject
- in relation to current events (the Suez/Veolia deal), an article by Mr Nussenbaum on anti-takeover defence mechanisms -> link_to_article
- relating to the takeover bid for Natixis, an article by Ms Devouge on the implications of passive management for takeover bids -> link_article
- an article by T. Hachette and E. Langer on the benefits of fairness opinions for shareholders -> link_article
- the risk map presented by the AMF on 5 July 2021 -> link_AMF_risk_map
Disclaimer & contact details
This study has been carried out for information purposes only, based on SORGEM Evaluation’s databases compiled from publicly available information on the AMF website.
The authors and SORGEM Evaluation accept no liability whatsoever for the transcription, analysis or interpretation of the information contained in this note.
Contacts for this study:
- Thomas HACHETTE, Partner, SORGEM Evaluation;
- Etienne LANGER, Assistant Manager, SORGEM Evaluation.

